

Personalized learning journeys for every student, cohort and subject.
Build a detailed picture of individual student performance, class trends and what future work will have the greatest impact.

 AccelerateInsights dashboard
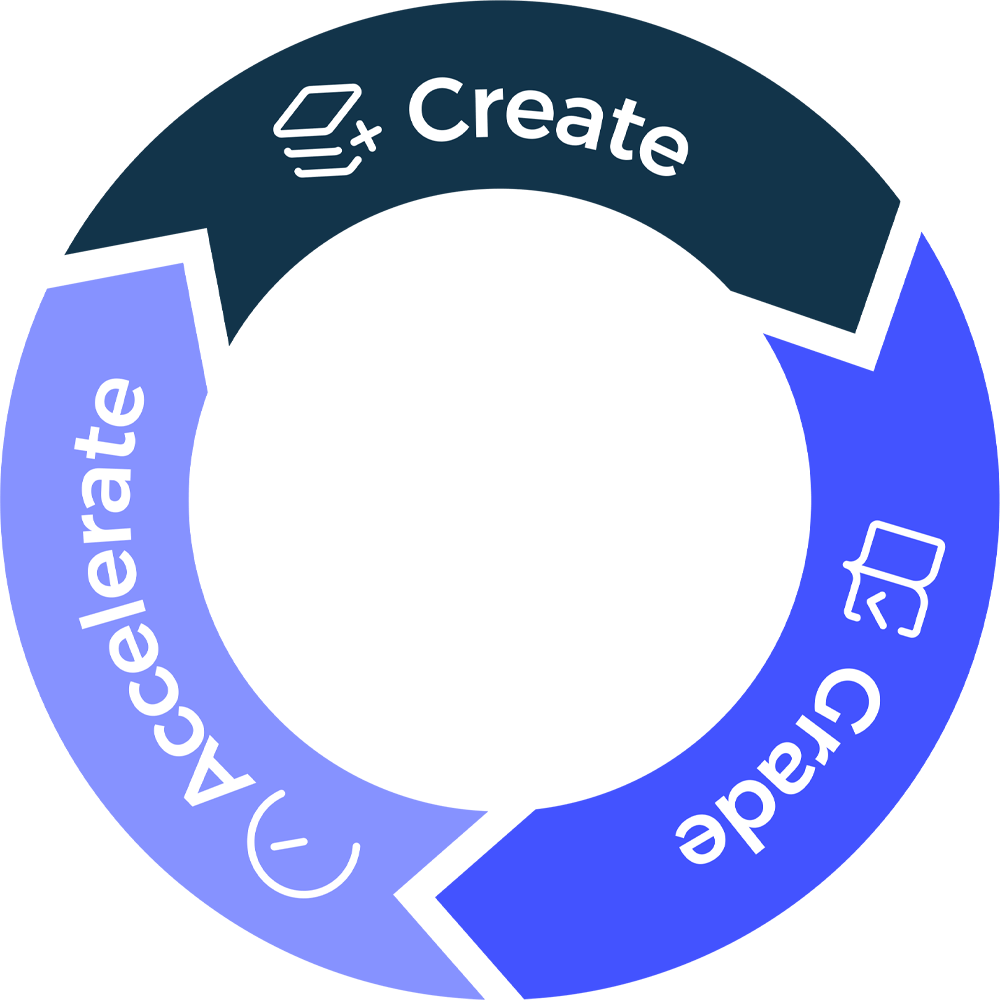
 Next: build a targeted resource in Create
From graded work to meaningful insight in an instant.

 Updated automatically
Every graded assignment feeds your Accelerate insights dashboard automatically, without any extra work on your part. Over time, SmartEducator builds a detailed picture for each student, class and teacher.
Everything is updated automatically, and all of it is actionable. That’s data that tells you what to do next – not just what happened.
 For class teachers
, it’s the information you always wanted but never had time to pull together.
 For school leaders
, it’s a live view of performance across classes and cohorts without the never-ending admin.
When your data is up to date and accurate, you can make the most effective and informed decisions for your staff and students alike. From individualized special education support and early interventions, to whole-school insights that give leadership teams proactive visibility, it’s the difference between knowing how things are going today and understanding what to do differently tomorrow.
Three levels of insight. One complete picture.
1The most granular view Accelerate offers – and often the most immediately useful. Drill into any individual student’s performance history across assignments and SmartEducator builds their picture for you. From where they’re consistently strong and struggling, to what kind of mistakes they keep making, you get specific, evidence-backed observations rather than general impressions.
 2
Step back from the individual and look at your class or cohort as a whole. The class-level view shows you:
- Score distributions across the full set of submissions
- A cognitive-pattern heat map showing where the class is collectively working
- The ‘What? / So What? / Now What?’ framework that highlights what the data is telling you, why it matters for your teaching and a specific, practical action to take in your next lesson to have the greatest impact
 3
For department chairs, senior leaders and principals, Accelerate offers a view that goes beyond the individual classroom. The whole-school insights layer tracks performance trends across every class, subject and grade level – giving leadership teams unrivaled visibility.
It’s the kind of longitudinal view that used to require careful – and time-consuming – manual record-keeping. Now it’s automatic, with consistent data you can trust every time.
| Remember | Understand | Apply | Analyze | |
|---|---|---|---|---|
| 9A | 82% | 74% | 61% | 44% |
| 9B | 78% | 69% | 48% | 39% |
| 9C | 71% | 66% | 57% | 52% |
| All | 77% | 70% | 55% | 45% |
Illustrative example
Accelerate
Bloom’s taxonomy at a glance.
Every graded question is sorted by the kind of thinking it asks for: Remember, Understand, Apply and Analyze. The heat map shows where your class is strong, and where their thinking needs stretching.
“
SmartEducator significantly improved our student feedback output and made it much easier for teachers to effectively monitor student progress over time. It's actual magic.
Ebrahim Demir
Senior IT Director
”
The insight is only the beginning…
The Accelerate insight dashboard is where the data lives, but its real power is in what happens next. Every insight surfaced in your dashboard is a prompt to act: to teach something differently, to support a student more specifically or to instigate changes that address the broader school needs.
And that’s where Create comes back in. Use your Accelerate insights to inform the next assignment you build – not the same homework for the whole class, but targeted resources shaped by how each student or cohort actually performed.
Ready to Accelerate your educational potential?
Start free with 3 creates and 3 grades, no card needed. Then unlock a 30-day free trial with everything included. Your insights dashboard starts building as soon as you grade – no setup, no waiting.